
This blog post outlines several data sources researchers and policy analysts can use to study student loan debt. It covers many of the standard sources to introduce readers who may be unfamiliar with the data landscape. But it also includes some less well-known sources that even the more experienced researcher might find useful for exploring.
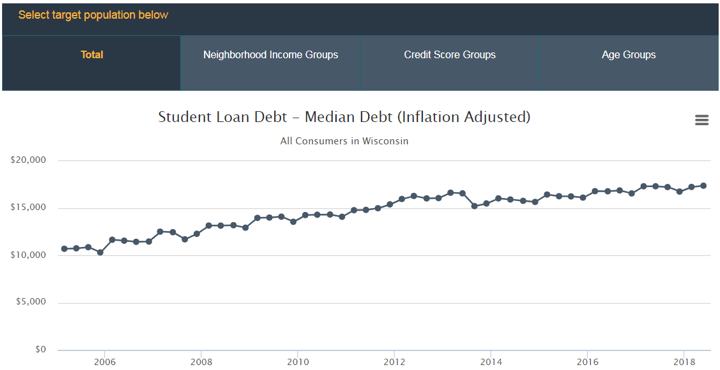
For example, we just learned the Federal Reserve’s Consumer Credit Explorer reports state-level student loan debt based on credit panel data. This resource shows what proportion of credit holders carry student loan debt, their median debt levels, and the percent who are severely delinquent. Data can be disaggregated to metropolitan statistical areas, age groups, credit score groups, and neighborhood income groups.
It allows us to see, for example, that the median student loan debt for credit card holders in Wisconsin is $17,323 and has stayed relatively flat for the past several years.
As with any data source, there are caveats, trade-offs, and limitations that need to be considered and explained. For example, the credit panel data do not link to enrollment records, so we do not see how debt and delinquency vary for college completers versus non-completers – something policymakers are increasingly concerned about. However, these data are generated from credit reports and made available each quarter, giving a timely and high-quality glimpse into the aggregate stock of student loan debt. In addition to this resource, the Federal Reserve’s quarterly Report on Household Debt and Credit includes additional aggregates (some at the state level) for outstanding student loan debt.
With this example in mind, the rest of this post walks through various student loan data sources that either take a snap-shot at a single point in time or that follow individuals over several years. It also includes aggregate student loan data at the college level that can be linked to various other data sources. In all cases, our hope is these resources can help researchers and policy analysts pinpoint problems facing the student loan system while imaging better ways to collect and distribute student loan data. With any luck, using these sources can help contribute to ongoing efforts to understand and improve student loans for current and future borrowers.
Cross-sectional data
National Postsecondary Student Aid Study (NPSAS). Beginning in the 1986-87 academic year, the NPSAS survey has collected extensive data on college students’ financial aid packages, demographics, academics, and educational expectations. The earlier surveys were conducted every three years: 1987; 1990; 1993; and 1996. It then went to a four-year survey cycle for the years: 2000; 2004; 2008; 2012; and 2016. Beginning in 2018, NPSAS will collect administrative financial aid records (but not surveys) on a two-year cycle to provide more recent estimates of national and, in some cases, state representative samples.
Unlike most other surveys outlined here, NPSAS is linked to administrative records from the National Student Loan Data System (NSLDS), resulting in accurate and up-to-date estimates of student loan debt. The NSLDS contains transactional data on federal Title IV loan programs including borrowers’ original principal balance, current repayment plan and loan status, along with outstanding principal and interest. Borrowers and their loan servicers can access NSLDS to monitor and manage their loans. Colleges and state agencies can access this to monitor and report federal loan data (e.g., calculating CDRs). NSLDS is not currently designed to be a research database, though it is possible to link to some records through research partnerships or via U.S. Department of Education surveys like NPSAS. With NPSAS, a researcher can examine student loan borrowing patterns during college. What proportion of students borrow? How much do they borrow? How do borrowing patterns vary by sector or students’ race/ethnicity, family income, or choice of major?
Survey of Consumer Finances (SCF). The Federal Reserve Board’s SCF surveys families on their net worth, income, and other financial information every three years. Beginning in 1989, the survey started asking questions about the amount of debt students borrowed and still owe. In 2016, it added questions about participation in income-driven repayment. This survey allows researchers to link self-reported student loan debt with a wide range of socioeconomic, financial, and demographic characteristics of borrowers. But when researchers linked SCF data to credit panel records, they found SCF respondents under-estimated their loan balances by 25%, and this gap may be widening over time. Nevertheless, the SCF is one of the very few data sources linking debt to income and wealth over multiple time periods.
Survey of Household Economics and Decisionmaking (SHED). Since 2013, the Federal Reserve Board’s SHED has been used to produce the Report on the Economic Wellbeing of U.S. Households. The survey focuses on a range of topics including credit access, retirement plans, economic fragility, and student loan debt. Its student loan questions focus on how much students borrowed for their education and whether they are behind on student loan payments. These data could be used to triangulate other self-reported sources while investigating the unique role student loans play in respondents’ overall financial situations.
Consumer Expenditure Survey (CE). The Bureau of Labor Statistics’ CE survey uses interviews and diaries to gather information about how respondents spend their money. The survey includes a wide range of demographic, income, and background details of the respondent and the weights from these expenditure items are used to calculate the Consumer Price Index. The survey has a long history dating to the early 1900s, but it wasn’t until 2013 that it began asking respondents about whether they borrowed student loans and, if so, how much they now owe. These data are now reported annually where researchers can examine how expenditures on loans correlate with other household expenditure items such as mortgage payment, car payments, and other detailed expenditures.
National Financial Capability Study (NFCS). The FIRA Investor Education Foundation sponsors the NFCS, a national survey measuring respondents’ perceptions and attitudes toward personal finance. Their data page includes state-level responses and their 2012 and 2015 surveys include questions about student loan debt and repayment.
Longitudinal data
National Center for Education Statistics (NCES) Longitudinal Studies of High Schoolers. The U.S. Department of Education National Center for Education Statistics (NCES) has a series of longitudinal studies following up with students from high school into college and the labor force. The National Longitudinal Study of 1972 (NLS-72) surveyed 12th graders in 1972 and followed up with them five times until 1986. The 1986 follow-up asked students whether they received loans to pay for college and, if so, how much. Similar questions were included in subsequent longitudinal studies. High School & Beyond (HS&B) surveyed 10th and 12th graders in 1980 and followed up multiple times until 1993. This survey linked to federal loan records, where respondents include information about whether and how much federal loan debt they borrowed since high school. The subsequent longitudinal studies are also linked to federal loan records, where the National Education Longitudinal Study of 1988 (NELS:88) surveyed 8th graders in 1988 and followed up with them several times until 2000, eight years after high school. The next NCES survey, Education Longitudinal Study of 2002 (ELS:02), followed 10th graders in 2002 until 2012, eight years after high school. The most recent NCES longitudinal survey, the High School Longitudinal Study of 2009 (HSLS:09), surveyed 9th graders in 2009 and has now followed up with them until 2016, three years after high school. Across these surveys, it is possible to measure the factors associated with borrowing, how much, and whether these patterns have changed since the 1970s. To my knowledge, this comprehensive analysis has not been done and would be a ripe area for research to make full use of existing student loan data.
National Center for Education Statistics (NCES) Longitudinal Studies of College Students. In addition to these surveys of high school students into young adulthood, NCES also has two postsecondary surveys following up with college students. The cross-sectional NPSAS survey spawns two longitudinal studies: Beginning Postsecondary Students (BPS) and Baccalaureate and Beyond (B&B). Both surveys are linked to NSLDS loan records where BPS follows up with first-year students throughout their college years and immediately into the labor force while B&B follows graduating seniors after college.
The current BPS follows up with the entering class of 2012 in 2014 and 2017. Prior BPS surveys followed up with the 1996 and 2004 cohorts of beginners for six years, and the 1990 survey followed up with students four years later. Many student loan problems are concentrated among borrowers who begin, but do not complete college. Because of this, the BPS survey is well suited for following up with students who leave college with debt and no degree. To measure long-term loan outcomes, rather than just six years after entry, NCES created a federal aid supplement showing loan repayment outcomes 20 and 12 years later for the 1996 and 2004 entering classes, respectively.
The current B&B survey follows up with the 2008 cohort of graduating seniors in 2012 and 2018. The first B&B followed up with the cohort of 1993 graduating seniors in 1994, 1997, and 2003. The second B&B did not follow graduating seniors for ten years, as other B&B surveys do; instead, it only followed up with the 2000 cohort of graduating seniors to 2001. The next B&B survey will follow up with the graduating class of 2016 in 2017, 2020, and 2026. Importantly, the B&B study selects only those students who made it to graduation, so any analysis of student loan debt should bear in mind that students who graduate with debt may be quite different than those who do not, making BPS and B&B useful for comparing the experiences of completers and non-completers.
Panel Study of Income Dynamics (PSID). Beginning in 1968, the PSID collected data from over 18,000 individuals living in 5,000 families. As those families grew, the PSID began collecting data not only on the original respondents but their decedents’ families. The survey now includes over 10,000 families and 24,000 individuals and is the world’s longest-running nationally representative household panel survey. Starting in 2005 and every odd year after that, it asks whether and how much respondents borrowed for college in its Transition into Adulthood Supplement (TAS) survey. TAS includes young adults between 18 and 28 years old and researchers can explore factors associated with borrowing before college entry, during college, and in respondents’ early years after leaving college.
National Longitudinal Surveys of Youth (NLSY). The Bureau of Labor Statistics has two surveys following up with young adults over the early life-course: the National Longitudinal Survey of Youth: 1979 (NLSY79) and the National Longitudinal Survey of Youth: 1997 (NLSY97). The original NLSY79 cohort included nearly 13,000 respondents between the ages of 14 and 22 in 1979; these individuals were between the ages of 51 and 60 in the 2016 follow-up survey. The original NLSY97 cohort included nearly 9,000 individuals between the ages of 12 and 18 in 1997; these individuals were between the ages of 30 and 36 in the 2016 follow-up survey. In both surveys, respondents are asked to self-report whether and how much money they borrowed for college.
Longitudinal Study of American Youth (LSAY). In 1986, the LSAY sampled a cohort of approximately 5,000 7th and 10th grade students and followed up with them for seven years. Then in 2007, LSAY resumed its annual surveys of this same cohort, following up with them until 2011. This survey asks respondents whether they ever borrowed money to pay for college and, if so, how much they currently owe (when they are in their late 30s). The survey also asks respondents to distinguish between undergraduate and graduate school debt, as well as other questions like whether their student loans interfered with their efforts to buy a home.
Campus-level data
Integrated Postsecondary Education Data System (IPEDS). The 1998 amendments to the Higher Education Act (HEA) mandated NCES to report the number of full-time, first-time degree/certificate-seeking undergraduates awarded student loans for all colleges and universities participating in federal Title IV programs. Beginning in 2000, these data are reported annually. The 2008 HEA reauthorization expanded annual reporting (beginning in 2009) to include the number, percent, and average amount of all federal loans awarded to undergraduates, but not graduate students.
Federal Student Aid (FSA) Data Center. The U.S. Department of Education’s FSA office provides reports for every college participating in federal Title IV aid programs. Their annual loan volume reports begin in the 1999-00 award year and, beginning in 2006-07, these reports are now released every quarter. These files provide the number and dollar amount of Direct Loan originations and disbursements for subsidized, unsubsidized (both for undergraduate and graduate students), Parent PLUS and Grad PLUS loans. The FSA data center also provides three-year Cohort Default Rates (CDRs) by school and program-level Gainful Employment debt-to-earnings rates, which measures the median annual loan payment amount for program completers. Finally, default rate data for the Perkins Loan program are archived here.
College Scorecard. The U.S. Department of Education’s College Scorecard includes a wide array of student loan data unavailable in IPEDS or the FSA data center. It reports federal loan repayment rates for cohorts one, three, five, and seven years after entering repayment. These rates are disaggregated by the borrower’s family income, Pell status, dependency status, gender, first-generation status, and whether or not they completed a degree. The Scorecard also reports median debt for these same groups (e.g., family income, Pell, completers, etc.) along with the median debt of completers reported in monthly payments (on a 10-month amortization plan). In addition to medians, it reports cumulative debt at the 10th, 25th, 75th, and 90th percentiles, but these are not disaggregated by student characteristics. The College Scorecard includes CDRs (from FSA) and percent of undergraduate borrowers (from IPEDS). Institution-level data are available annually from 1996-97 to 2017-18. In May 2019, the College Scorecard released preliminary data on average and median debt for completers by their field of study and degree program.
Common Data Set. The Common Data Set is a voluntary survey sponsored by Peterson’s and available to purchase here. Section H includes data on the number, percent, and average cumulative principal balance among graduating seniors who started college at the same institution. The Institute for College Access & Success’ College In-Sight is a useful tool for exploring these figures at the campus level along with other fields from the CDS.
Brookings Institution. The Brookings Institution hosts a page titled Measuring Loan Outcomes at Postsecondary Institutions which contains several excel files of aggregate loan data at the campus level for undergraduate, graduate, and PLUS borrowers. The data includes mean, median, and 1st-10th decile debt balances of students entering repayment in FY2009. It also tabulates the total remaining balance for the cohort by institution for each of the following five years. This page also provides cohort repayment and default rates, as well as institutions’ total balance of debt in default as of FY2010-FY2014 and rates of deferment or forbearance participation. These data were produced by FSA, but are unavailable on the FSA website.
Center for American Progress. Researchers at the Center for American Progress obtained previously unreleased data on default, delinquency, and pay-off rates for more than 4,700 colleges. The data follow the 2012 repayment cohort for five years, measuring the annual number of borrowers whose loans are paid off, current, delinquent, in deferment, or in default. It also includes data on the annual total loan balance for each of these outcomes, offering a proof of concept for the kind of data loan repayment that can be made available for other cohorts.
This is our first attempt to pull all these resources together in a single place. We have not used all of these sources in our own work, so our familiarity and expertise is limited. Our job here was to curate a list that we believe can be useful for researchers who are hungry for student loan data but are often constrained by data availability. We are of the mindset that the research community should take full use of these sources and, in so doing, can contribute to productive conversations and actions related to improving data quality and public policy in the service of current and future student loan borrowers. The following table summarizes and provides links to sources outlined in this post. All errors or omissions are ours alone and we appreciate any constructive feedback and insights you’d like to offer if you’ve read this far!
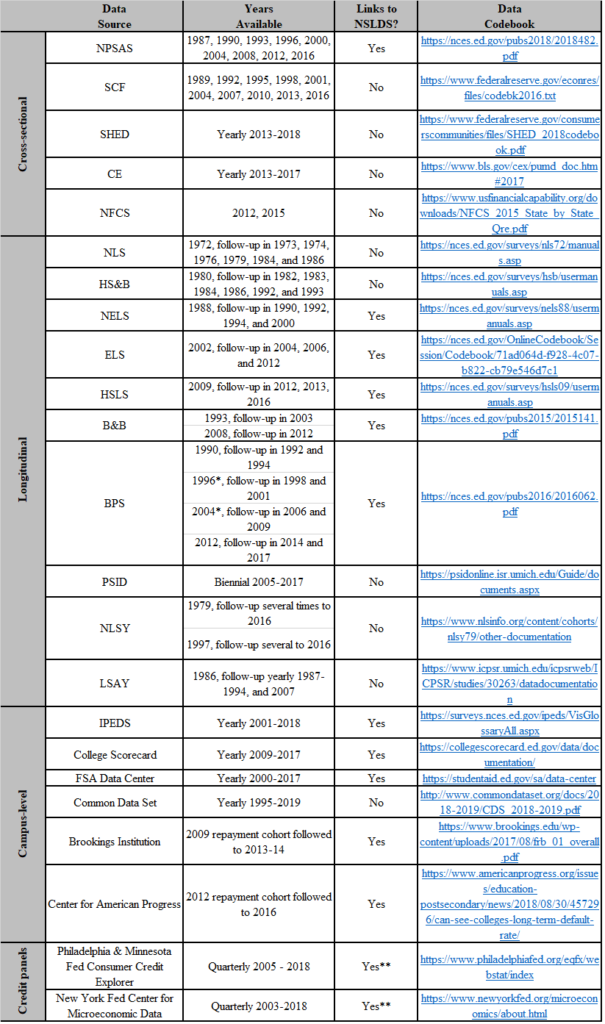
* See the 2015 FSA supplement, the 20-year follow-up to 1996 and 12-year follow-up to 2004 cohorts: https://nces.ed.gov/pubs2018/2018409.pdf
** To the best of our knowledge, loan servicers report student loan debt to credit bureaus using NSLDS records